Administrator Dashboard
The administrator dashboard features a graphic overview to assist you in monitoring the system. Its widgets show various system statistics for detailed analysis, including reports and drill-downs to forensics screens.
Data Ownership
Data Ownership displays the number of resources with classified data, which are also missing an assigned data owner (who are required to review and approve users’ access to resources). This widget also displays the compliance score. You can generate a report that contains a detailed list of resources.
This widget is updated once a day (default). Click the “Update Now” link to refresh the data.
Sensitive Data Exposure
Sensitive Data Exposure displays the number of resources with classified data that allow access to a large group of users (overexposed). This widget also displays the compliance score. You can generate a report that contains a detailed list of the resources and groups. To view and define overexposed resource settings, navigate to Settings > General > Overexposed Resources.
This widget is updated once a day (default). Click the “Update Now” link to refresh the data.
System Health Check
System Health Check displays the status of system services. You can view the list of inactive services, and restart one or more services.
This widget is updated live.
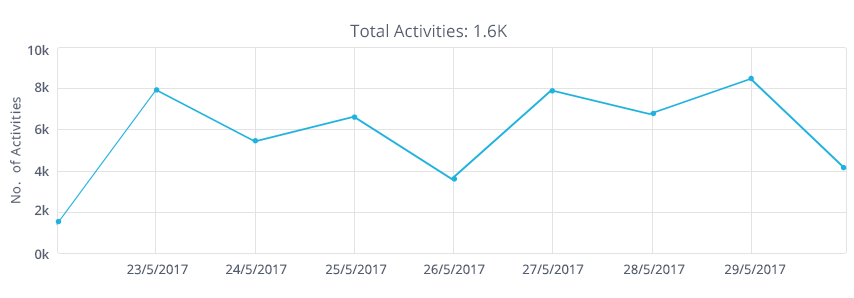
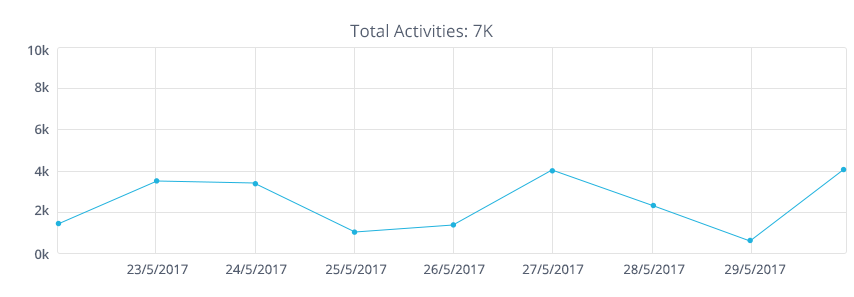
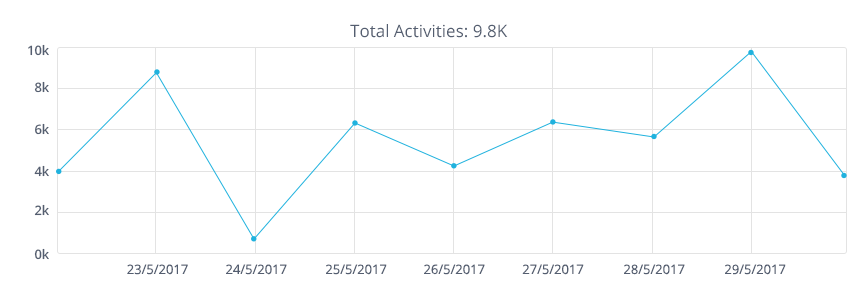
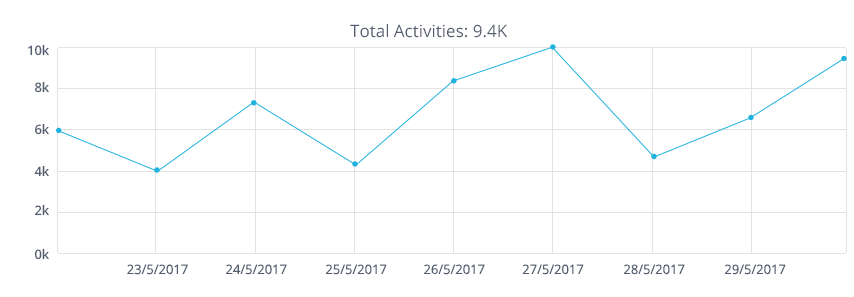
Activity Statistics
Activity Statistics displays a trend graph of activities per application. Each tab represents a different application. Add or remove tabs (up to 5) to set the time resolution and to select which applications to monitor. Click on the graph to drill down to the activity forensics screen. You can also generate a report that contains a detailed list of activities.
This widget is updated online. Reload the page to refresh the data.
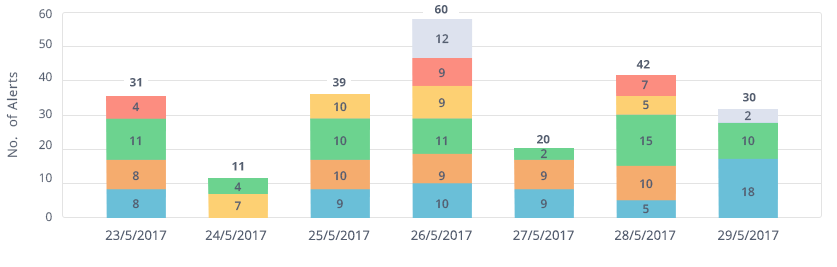
Alerts in Last 7 Days
Alerts in Last 7 Days displays the number of alerts created within the last seven days, with an indication of the five access rules with the most alerts. You can also generate a report that contains a detailed list of alerts.
This widget is updated online. Reload the page to refresh the data.
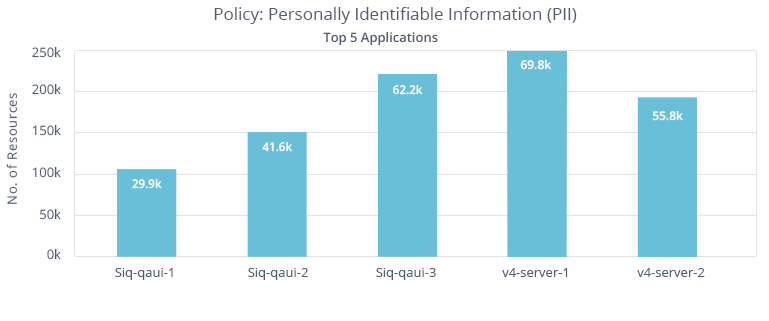
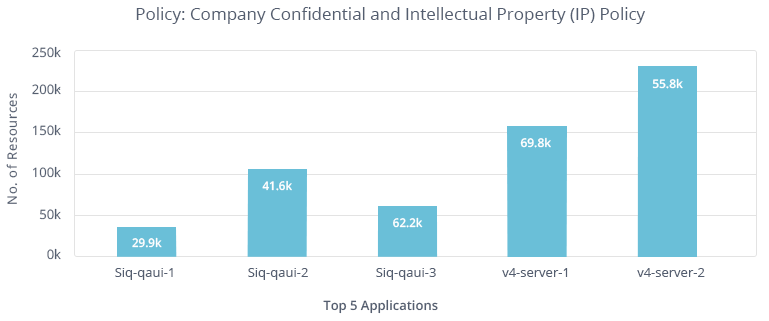
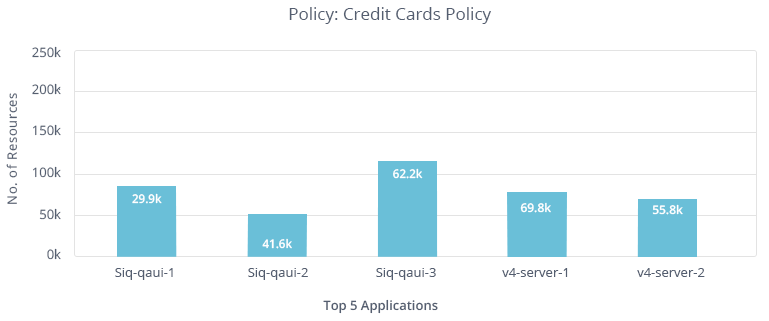
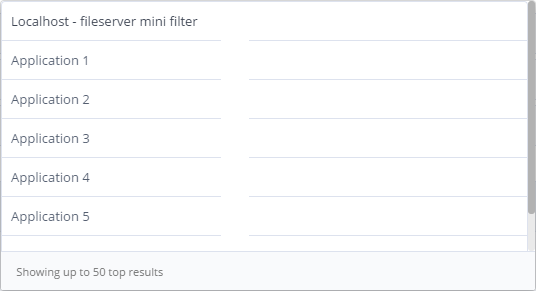
Active Data Classification Policies
Active Data Classification Policies displays the active data classification policies, with a separate tab for each policy. Each tab displays the five applications with the most policy-classified resources. Click on an application bar to drill down and view the list of classified resources in the selected application. You can also generate a report that contains a detailed list of all resources classified by a selected policy.
This widget is updated once a day (default). Click the “Update Now” link to refresh the data.
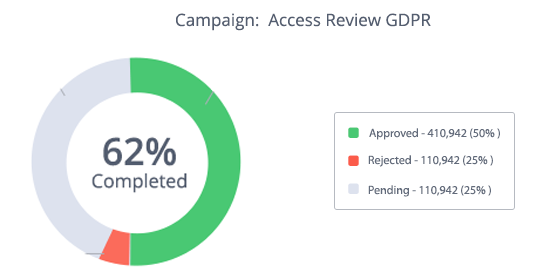
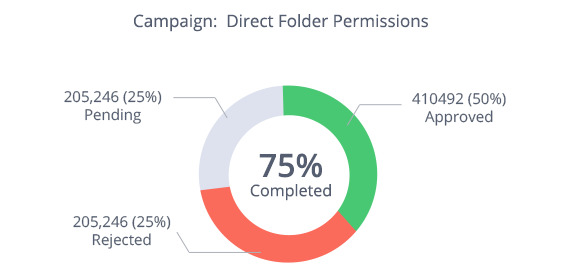
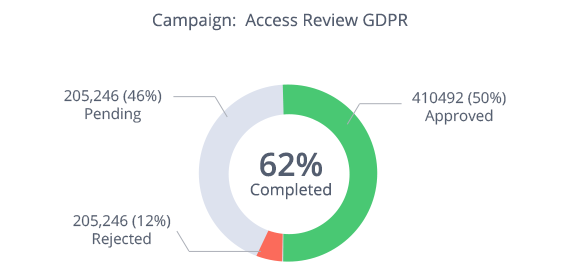
Active Campaigns
Active Campaigns displays the progress of active campaigns, with a separate tab for each campaign. Click on the graph to drill down to the campaign screen. You can also generate a report that contains a detailed list of campaign records and the status of each record.
This widget is updated once a day (default). Click the “Update Now” link to refresh the data.
Top Sensitive Resources by Activity
Top Sensitive Resources by Activity displays a list of the resources with classified data that have the most activities within the selected timeframe. A tool tip for each resource displays a list of categories for that resource.
This widget is updated online. Reload the page to refresh the data.
Top Users with Pending Tasks
Top Users with Pending Tasks displays a list of users with the most pending tasks. Examples of tasks include (1) access certifications or (2) access requests. You can send a reminder email to users to notify them of the tasks that are still pending.
This widget is updated once a day (default). Click the “Update Now” link to refresh the data.